Cube Analytics
View card distribution, mana curve, and price data for this cube.
Total Cards
1,008
10 unique type labels
Avg. Mana Value
2.93
Median 3.0
Creatures
556
55.2%
Color Identities
21
175 gold cards
Total Price
$871.01
USD estimate
Color Distribution
Color groups counted once per card.
1,008
Cards
Color Identities
21
Gold Cards
175 (17.4%)
Mana Curve
Converted mana cost distribution across the cube.
Mana Base Analysis
Fixing, ramp, lands, and color commitment.
Oracle Tags needed
0.0% of this cube has Oracle Tags. Retrieve them to enable mana base analytics.
Removals per Color
Removal-tagged cards grouped by color.
Oracle Tags needed
0.0% of this cube has Oracle Tags. Retrieve them to enable removal analytics.
Curve by Color
Monocolor mana curves side by side.
Card Types
Primary type breakdown for the main deck.
1,008
Cards
Highest Price Cards
Top cards by available Scryfall USD price.
1
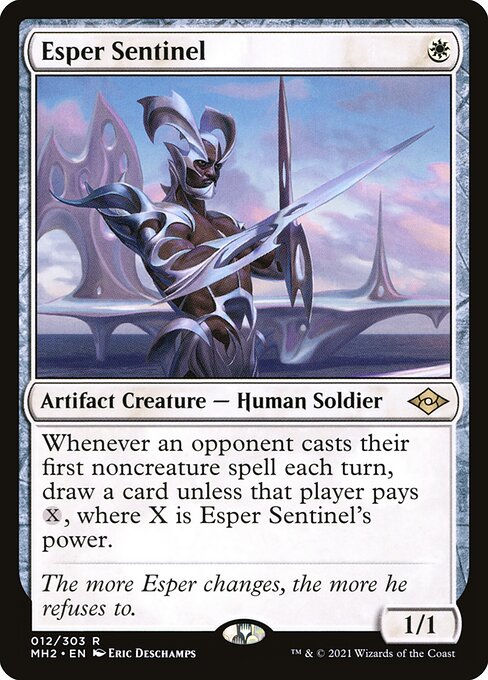
Esper Sentinel
Creature
$58.16
2
Ragavan, Nimble Pilferer
Creature
$50.42
3
Urza's Saga
Enchantment
$40.29
4
Scalding Tarn
Land
$38.12
5

Misty Rainforest
Land
$36.92
6

Solitude
Creature
$36.82
7
Arid Mesa
Land
$32.17
8
Marsh Flats
Land
$31.21
9
Cabal Coffers
Land
$31.21
10
Verdant Catacombs
Land
$30.87
Mana Curve Heatmap
CMC density across color groups.
Very Low
Low
Med
High
Peak
| CMC | White | Blue | Black | Red | Green | Colorless | Gold | Total |
|---|---|---|---|---|---|---|---|---|
| 0 | 1 | 2 | 2 | 1 | 1 | 17 | 61 | 85 |
| 1 | 25 | 26 | 18 | 22 | 21 | 12 | 5 | 129 |
| 2 | 37 | 41 | 40 | 36 | 39 | 25 | 24 | 242 |
| 3 | 26 | 29 | 25 | 28 | 40 | 24 | 48 | 220 |
| 4 | 19 | 17 | 32 | 31 | 21 | 10 | 10 | 140 |
| 5 | 21 | 12 | 23 | 11 | 14 | 3 | 17 | 101 |
| 6 | 7 | 13 | 3 | 6 | 6 | 6 | 41 | |
| 7 | 10 | 8 | 3 | 9 | 3 | 7 | 40 | |
| 8+ | 1 | 3 | 1 | 1 | 4 | 10 | ||
| Total | 146 | 148 | 147 | 147 | 146 | 99 | 175 | 1008 |
Loading CubeForge...