Cube Analytics
View card distribution, mana curve, and price data for this cube.
Total Cards
926
8 unique type labels
Avg. Mana Value
2.57
Median 2.0
Creatures
523
56.5%
Color Identities
21
157 gold cards
Total Price
$354.99
USD estimate
Color Distribution
Color groups counted once per card.
926
Cards
Color Identities
21
Gold Cards
157 (17.0%)
Mana Curve
Converted mana cost distribution across the cube.
Mana Base Analysis
Fixing, ramp, lands, and color commitment.
Oracle Tags needed
0.0% of this cube has Oracle Tags. Retrieve them to enable mana base analytics.
Removals per Color
Removal-tagged cards grouped by color.
Oracle Tags needed
0.0% of this cube has Oracle Tags. Retrieve them to enable removal analytics.
Curve by Color
Monocolor mana curves side by side.
Card Types
Primary type breakdown for the main deck.
926
Cards
Highest Price Cards
Top cards by available Scryfall USD price.
1
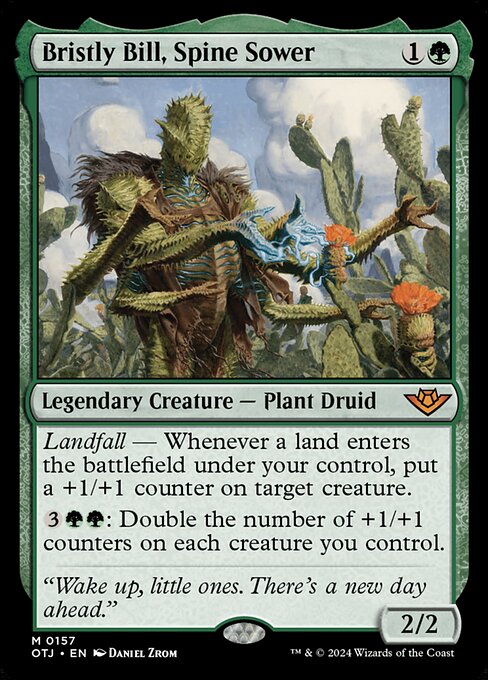
Bristly Bill, Spine Sower
Creature
$44.46
2
Terror of the Peaks
Creature
$30.90
3
Slickshot Show-Off
Creature
$9.38
4
Three Steps Ahead
Instant
$7.81
5
The Gitrog, Ravenous Ride
Creature
$7.01
6
Spirebluff Canal
Land
$6.18
7
Gisa, the Hellraiser
Creature
$6.10
8
Goldvein Hydra
Creature
$5.95
9
Tinybones, the Pickpocket
Creature
$5.91
10
Kambal, Profiteering Mayor
Creature
$5.86
Mana Curve Heatmap
CMC density across color groups.
Very Low
Low
Med
High
Peak
| CMC | White | Blue | Black | Red | Green | Colorless | Gold | Total |
|---|---|---|---|---|---|---|---|---|
| 0 | 21 | 65 | 86 | |||||
| 1 | 25 | 28 | 27 | 20 | 17 | 3 | 120 | |
| 2 | 43 | 34 | 50 | 50 | 52 | 21 | 22 | 272 |
| 3 | 35 | 32 | 26 | 39 | 30 | 18 | 33 | 213 |
| 4 | 19 | 29 | 22 | 14 | 19 | 22 | 125 | |
| 5 | 15 | 19 | 7 | 16 | 10 | 3 | 13 | 83 |
| 6 | 3 | 6 | 1 | 12 | 2 | 24 | ||
| 7 | 3 | 3 | ||||||
| 8+ | 0 | |||||||
| Total | 140 | 142 | 141 | 140 | 140 | 66 | 157 | 926 |
Loading CubeForge...